Let’s talk about the Dynamics GP Inventory Item History Window. This is a “hidden” window that not many folks know about. It is accessed not from a menu, but only from the GoTo on Item Maintenance or Item Inquiry. *Edit – David Musgrave pinged me after posting that he used the GP Power Tools and this window is actually on a menu but not in an expected spot – it is under Inventory > CARDS! – see note at the end for more discussion on this.
There are many posts on where the data comes from – but sadly most are not accurate.
I had a client asking questions about this window – so I figured I would post where the data really comes from. First, all of this is controlled by the “keep history” checkboxes on EACH item maintenance card (options button bottom right – Keep History: Calendar or Fiscal). No history checkboxes, no records in this window.
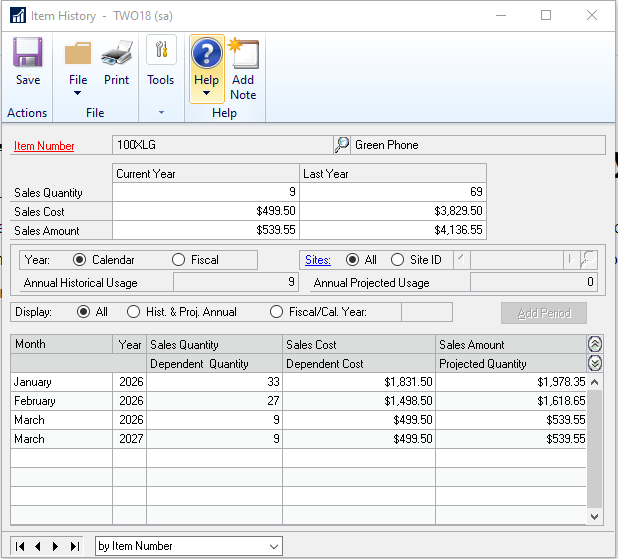
The top section with Current year and Last Year is SALES numbers from the SQL table IV30101 (Inventory Sales Summary History). During the inventory year end close routine, the current year numbers are moved to Last year and then cleared out. Since this is NOT date sensitive, but based upon when the routine is run – these numbers might not be accurate.

The radio button in the middle left “Year: Calendar/Fiscal” changes the display in the bottom grid.
Further to the right you can select a specific site filter for this grid, or leave it to display the record for all sites.

Annual Historical Usage uses your GP system date to total up the prior period history records for BOTH sales and demand. Help says it “Displays the annual usage quantity for the selected item, calculated from sales and dependent demand history for the last year, starting with the month or period prior to the current month or period” The Projected Usage is interesting, but I have never seen anyone use it – Check out the help > about this window for more information.
The Lower grid contains summary data updated by transaction posting from SQL table IV30102 (Inventory Sales Summary Period History).
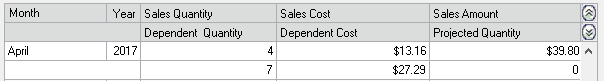
The first row displays sales totals, additionally the second row shows item usage in Inventory assemblies or Manufacturing Orders as “Dependent Quantity” (press the down chevrons on the far right of the title bar to see the second row.)
I have had clients use this data in SmartLists and/or other analysis tools besides using it in this screen.
Hopefully this is helpful.
Best, Devon
** Edit – post discussion — I find that GP programmers put this window under Cards and not Inquiry fascinating, probably related to the “Projected usage” feature that I mentioned above. But it brings up an VERY important point that I missed in the original post — the fields are able to be changed (editable) by users. The top annual fields are editable all the time and the lower grid fields are editable when a specific site is selected.
